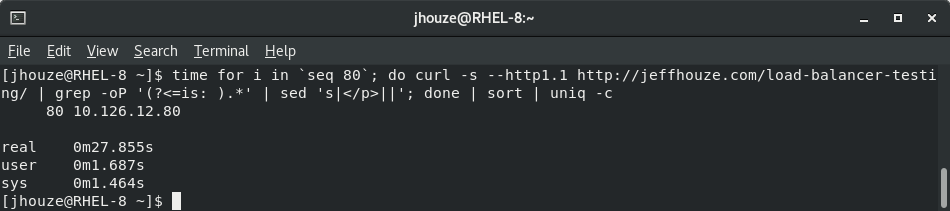
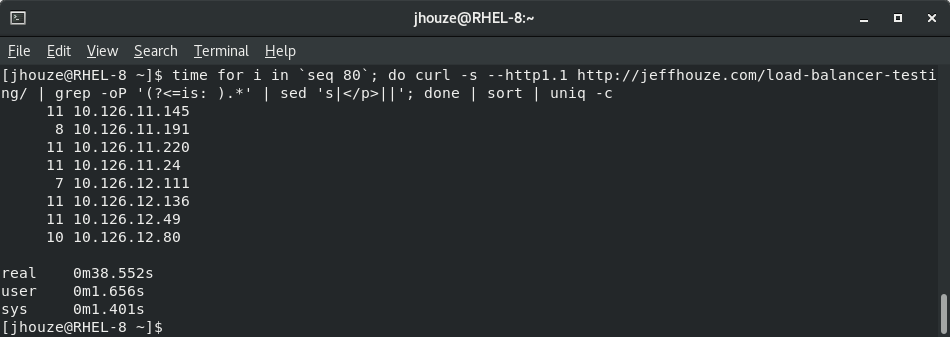
First two images are results of testing with ” Target Tracking scaling” and scraping this page https://jeffhouze.com/load-balancer-testing/ to show the results are from different instances

This in in UTC time, so five hour ahead of the date results below. I was running the stress command on new instances to trigger autoscaling.
All 40 responses from 1 server. Started stress command on it, and autoscaling rules created second server in the other subnet which in a different availability zone. Logged into that instance and launched stress, and a third server came up back in the first subnet. This is where thing get fun with diminishing returns. I had a target of 70% cpu utilization, 3 instances going flat out would still be 75% avg utilization with four servers, so this results in 5 instance being launched. Got up to 7 instances, before starting to stop the stress processes and letting it scale in.

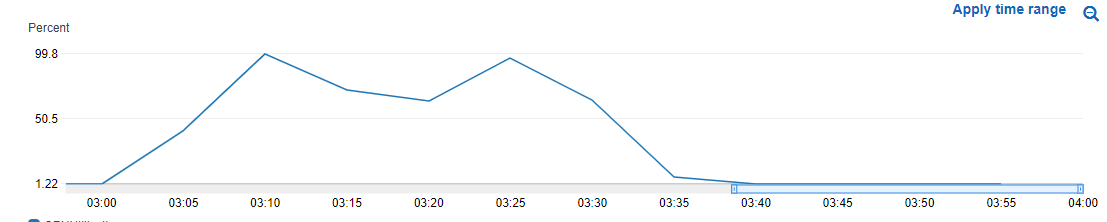
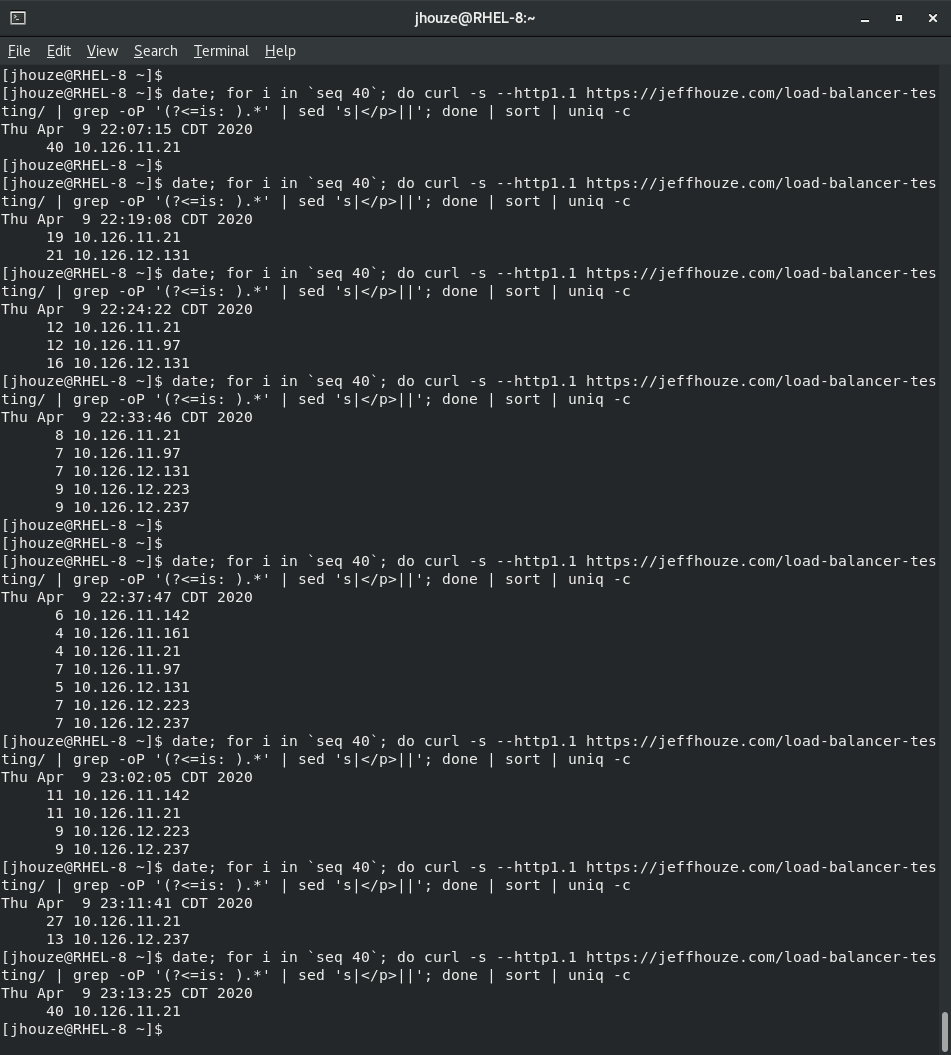
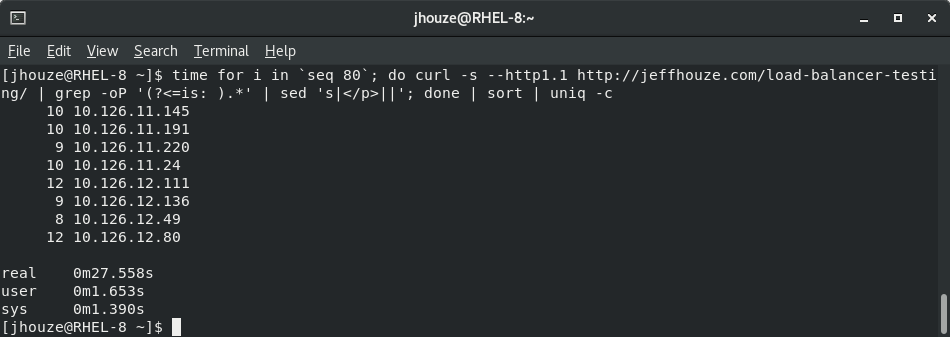
The rest of this page I’m still scraping the same page as above, but illustrating the benefits of a caching plugin, and a unintended side effect.

I’ve set the desired, min and max to eight. Loop requesting page 80 times, and scraping the server ip. That is slow, but it’s spread fairly evenly
Let’s throw a caching plugin in the mix. Well that was much faster, but the servers are all returning the same cached page. Not all the requests actually went to the 10.126.12.80 instance.
Let’s reconfigure the plugin to cache somewhere on the local EBS volume instead of the share EFS mount. This is correct results, but one last thing to note is each server is now generating it’s own copy of the page which took a bit of time.
And finally the correct dynamic value is returned and the page load is less than have a second per request 27.5/80.